Six Strain Types六型病毒株
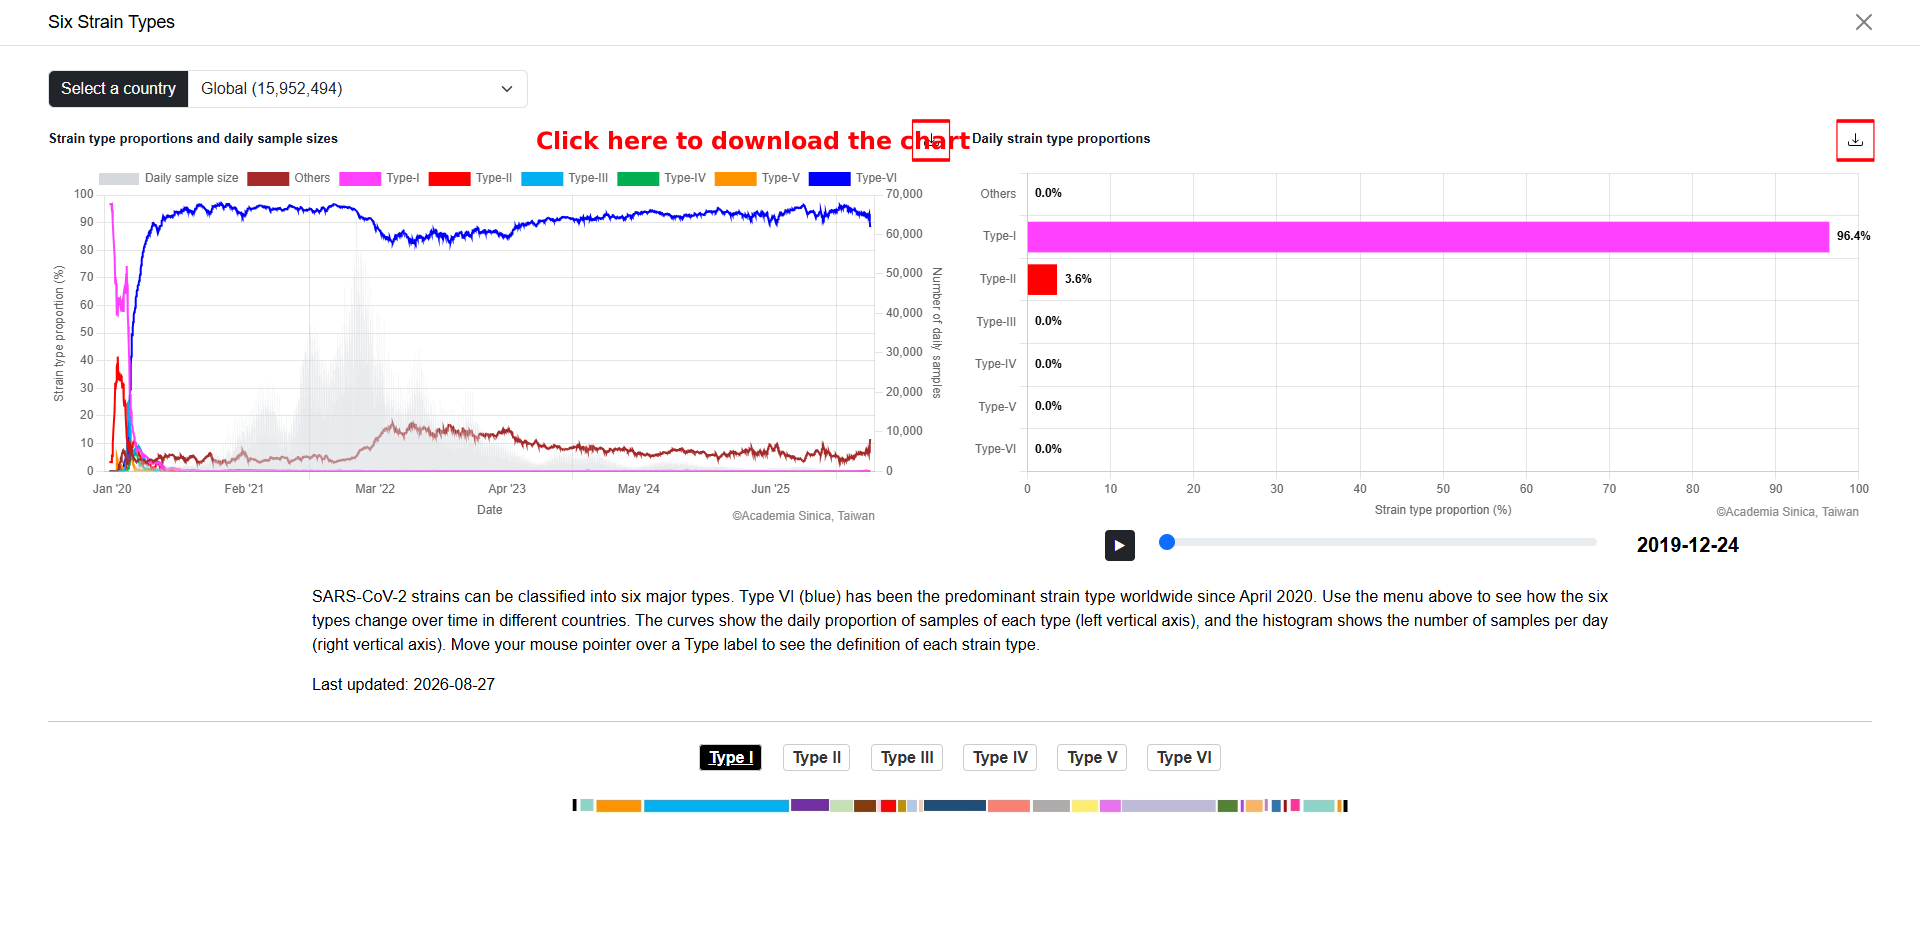
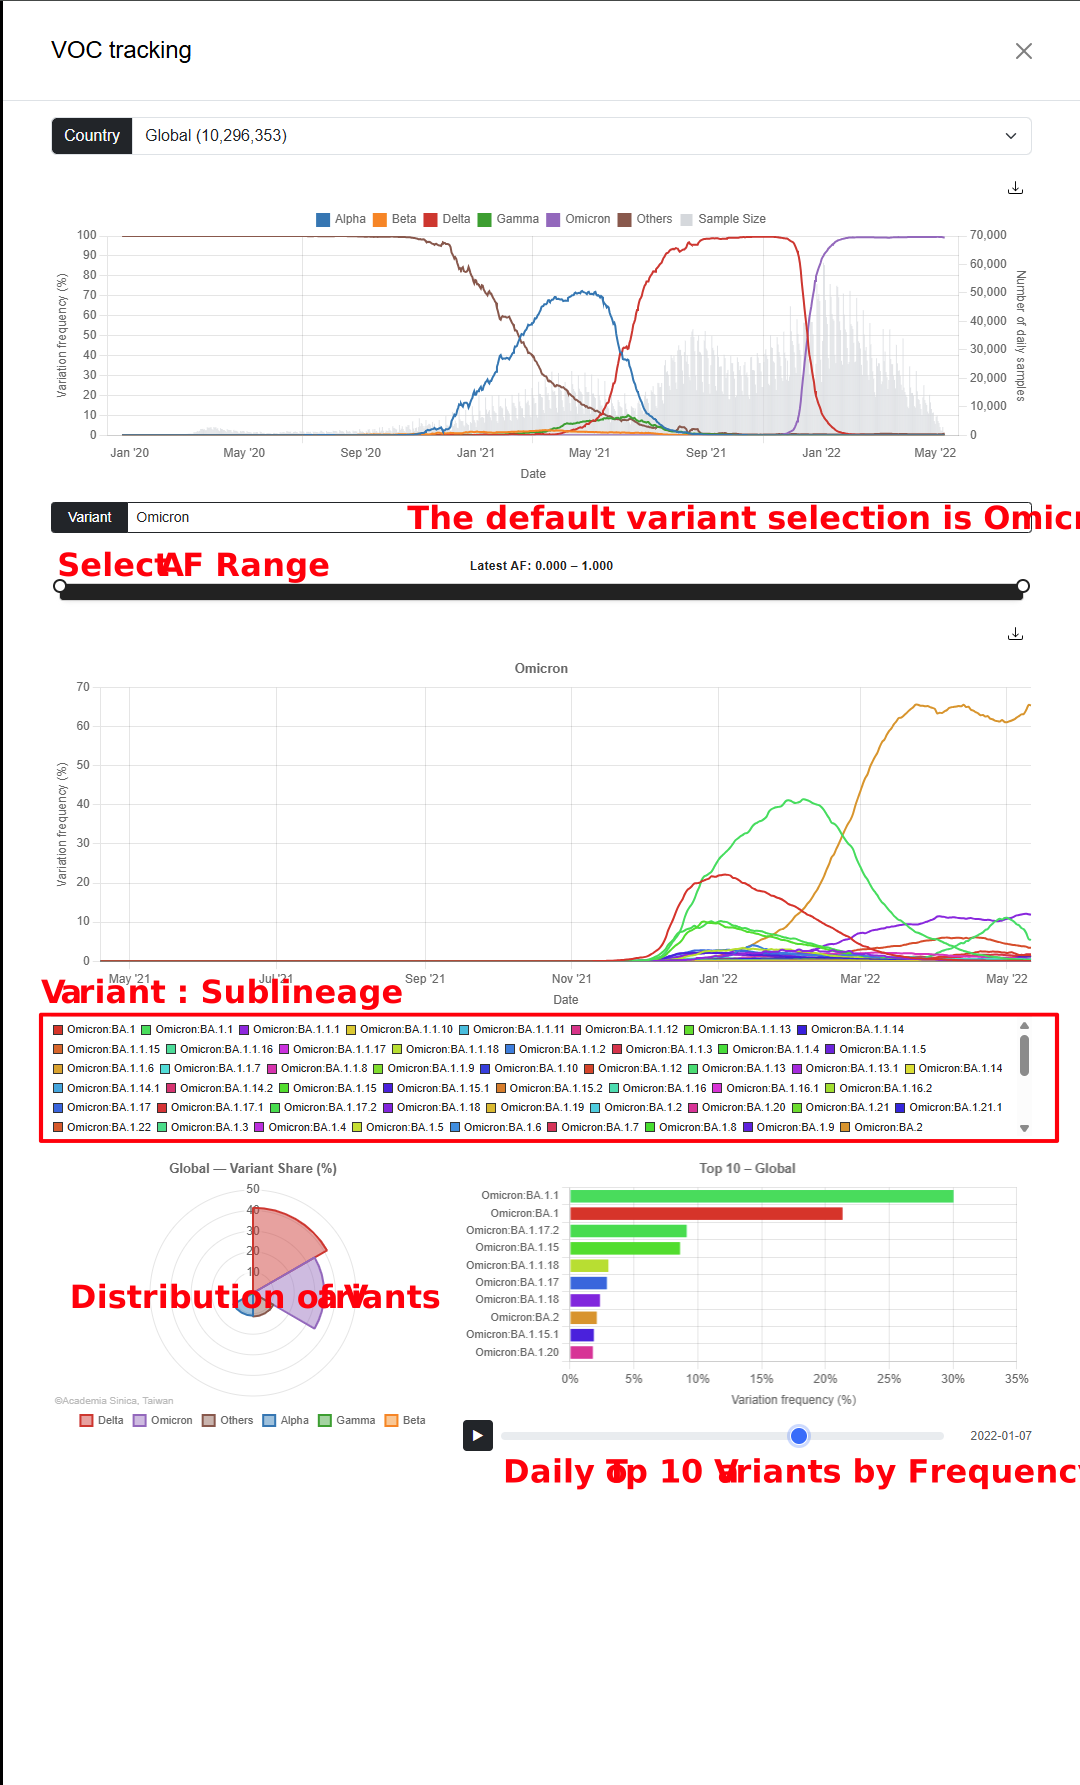
SARS-CoV-2 strains can be classified into six major types. Type VI (blue) has been the predominant strain type worldwide since April 2020. Use the menu above to see how the six types change over time in different countries. The curves show the daily proportion of samples of each type (left vertical axis), and the histogram shows the number of samples per day (right vertical axis). Move your mouse pointer over a Type label to see the definition of each strain type.
新型冠狀病毒株可分為6大型,第6型 ( 藍色 ) 自今年4月已成為全球最主要的病毒株類型。使用者可透過上方選單來查看不同國家6大型隨時間的變化,曲線呈現6大型每天的病毒株樣本的比率隨著時間的變化 (左縱軸),直方圖表示每日病毒株樣本的數量 (右縱軸)。游標移到 Type 處會出現各病毒株類型的定義。
Last updated最後更新: 2026-08-27

Emerging Genomic Variation新興基因體變異
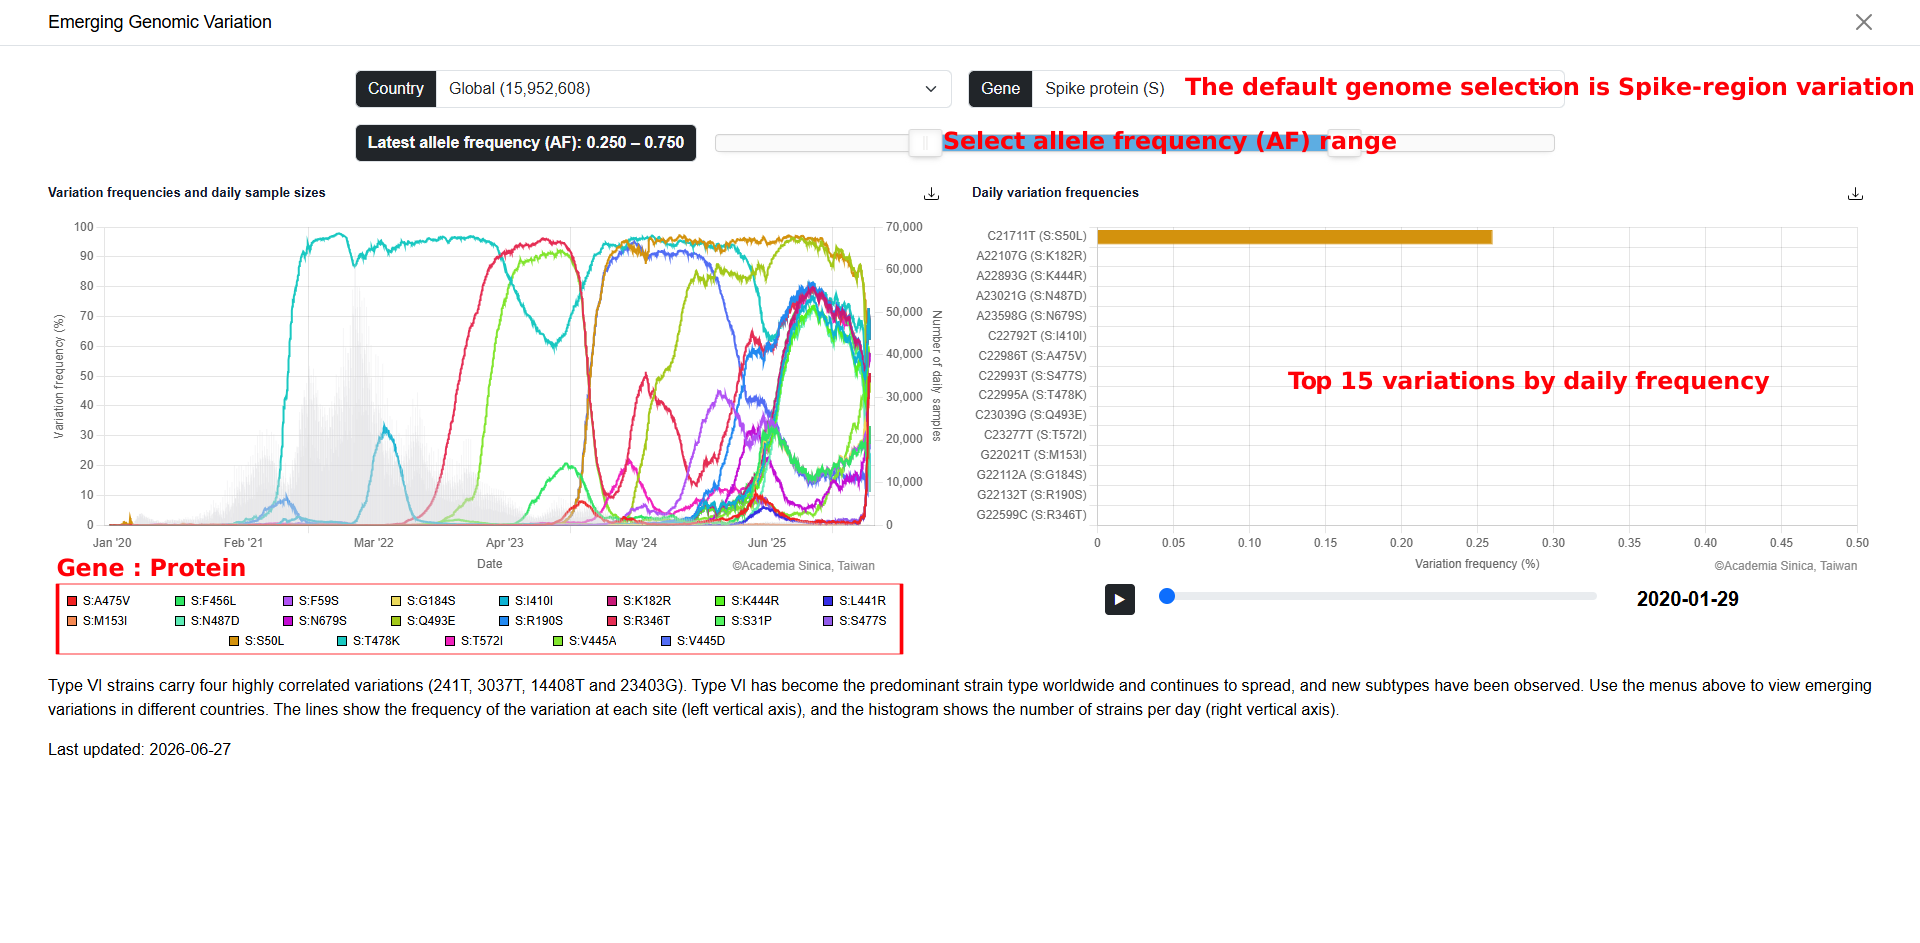
Type VI strains carry four highly correlated variations (241T, 3037T, 14408T and 23403G). Type VI has become the predominant strain type worldwide and continues to spread, and new subtypes have been observed. Use the menus above to view emerging variations in different countries. The lines show the frequency of the variation at each site (left vertical axis), and the histogram shows the number of strains per day (right vertical axis).
第6型病毒株帶有四個高相關的變異 (241T、3037T、14408T、23403G) ,目前成為全球最主要的病毒株類型,且持續傳播,也觀察到新的亞型出現。使用者可透過上方選單來查看不同國家的新興變異,線表示特定位點的變異頻率 (左縱軸),直方圖表示每日病毒株數量 (右縱軸)。
Last updated最後更新: 2026-06-27